EXCEL DASHBOARD & BUSINESS ANALYSIS
Café Harmony
Sales, Customer & Operations Analysis
Microsoft Excel
Dashboard
Data Analysis
Business Reporting
I built this Excel project to look at sales, customers, employees, stock and customer ratings at Café Harmony. I then brought the main numbers together in one interactive dashboard.
Project Overview
I built this Excel project to understand what was happening across different parts of Café Harmony. I looked at sales, products, customers, employees, stock and customer ratings. Instead of keeping the information in separate datasets, I brought it together in Excel and created one dashboard where the main numbers and patterns could be seen more easily.
Tool: Microsoft Excel
Project Type: Business Analysis & Dashboard
Focus Areas: Sales, Customers, Employees, Inventory and Feedback
Questions I Wanted to Answer
01
Menu Performance
Which menu items generated the most sales revenue?
02
Customer Spending
Which customer groups contributed the most sales?
03
Stock Management
Which stock items showed the greatest need for attention?
04
Employee Performance
Which employees performed above or below their sales targets?
05
Customer Feedback
What did customer ratings show about their overall experience?
How I Worked With the Data
01
Clean & Validate
Reviewed the datasets for missing values, duplicates, inconsistent information and data-quality issues.
02
Prepare the Data
Organized the data and created the fields needed for the analysis using Excel formulas and functions.
03
Analyze
Used PivotTables and calculations to examine sales, customers, employees, stock and customer ratings.
04
Build the Dashboard
Created charts, KPI cards and slicers and brought the main results together in an interactive Excel dashboard.
05
Interpret the Results
Reviewed the findings and identified the information that would be most useful for business decision-making.
The Dashboard
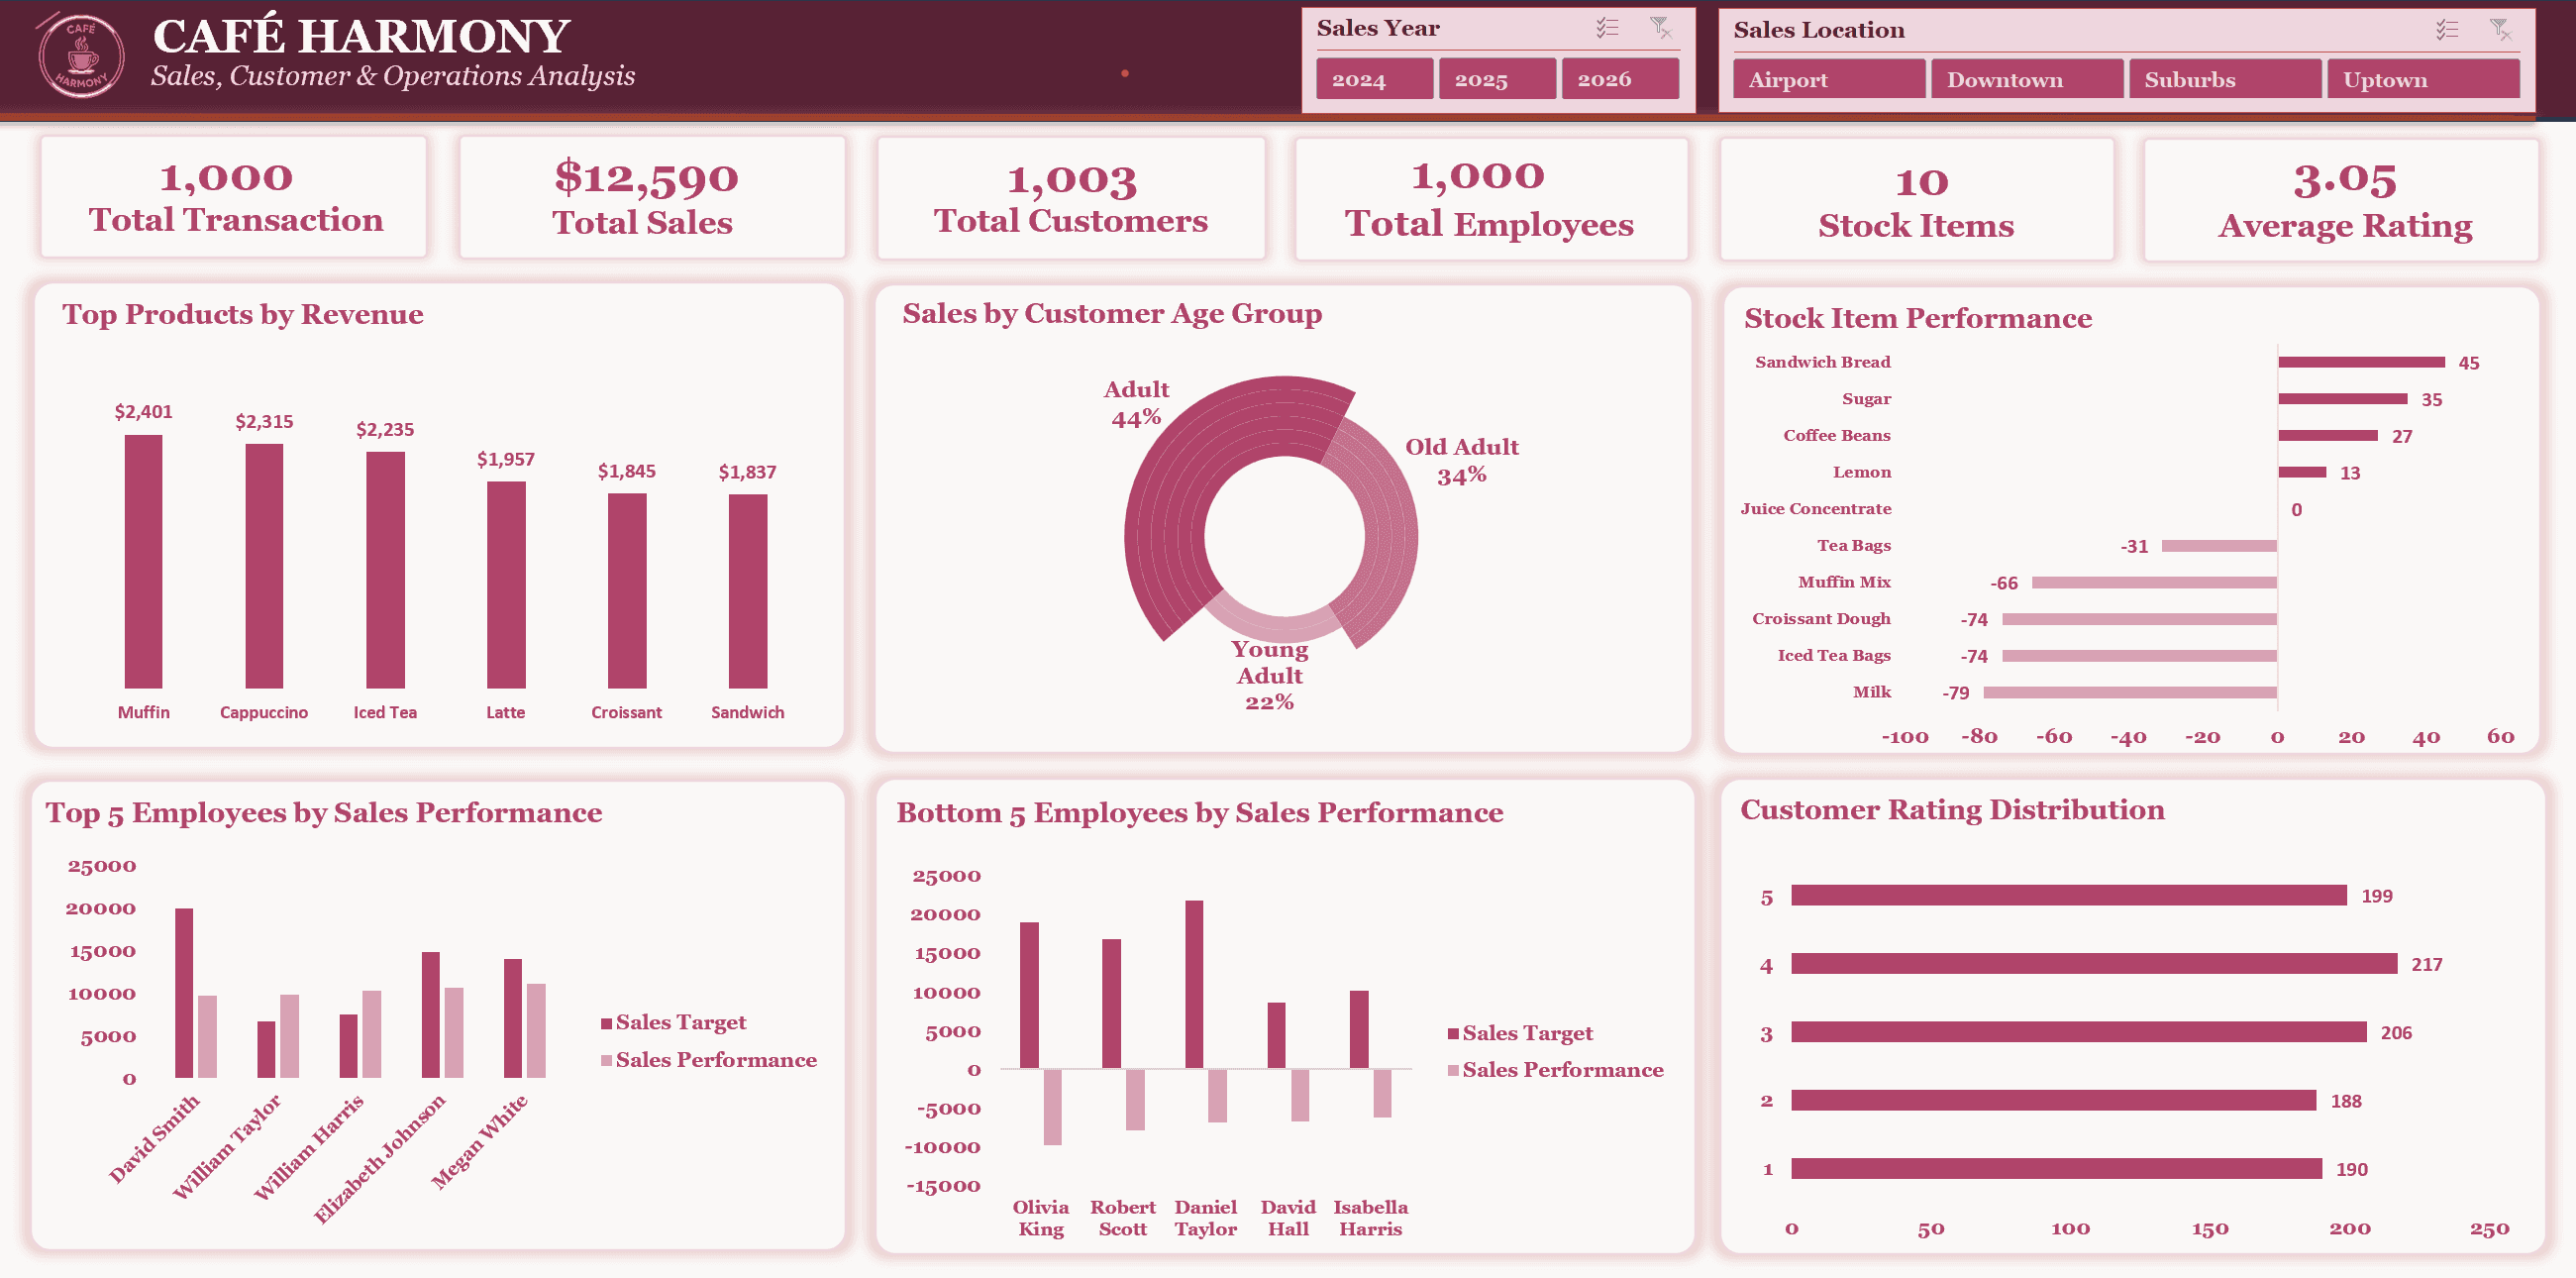
The dashboard brings sales, customer, employee, stock and customer-rating information together in one place so the main results can be reviewed quickly.
Excel
5 Business Datasets
2024–2026
Interactive Dashboard
What Was Selling?
Muffin brought in the most revenue at about $2,401. Cappuccino followed closely at $2,315, while Iced Tea generated $2,235.
Looking at the products this way made it easy to see which menu items were bringing in the most sales.


Who Was Spending the Most?
Among the three age groups used in the analysis, the Adult group contributed the most sales at about $5,502, followed by Old Adult at about $4,241 and Young Adult at about $2,846. This shows that the Adult group was the strongest customer segment by spending and may be especially important when Café Harmony reviews products, promotions and customer targeting.
Age groups were created from customer ages in Excel to make spending patterns easier to compare.
Where Did Stock Need Attention?
Milk had the largest negative stock-performance value at -79. Croissant Dough and Iced Tea Bags followed at -74 each, while Muffin Mix was -66 and Tea Bags was -31. These negative values flag the stock items that need the closest attention, with Milk showing the largest gap in the stock-performance measure.
This does not necessarily mean the item had zero stock. It means the item showed a negative result in the stock-performance measure used in this analysis and should be reviewed for possible replenishment needs.

How Did Employee Sales Compare With Targets?
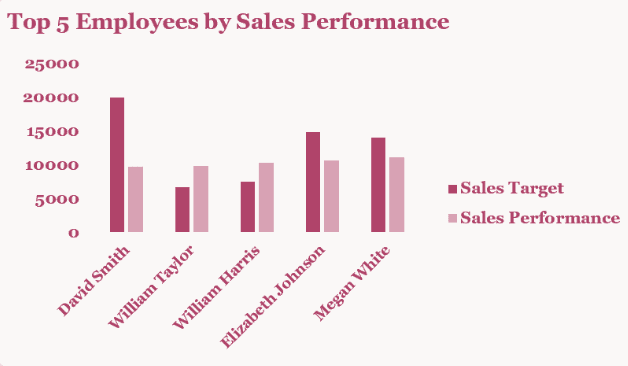
Megan White had a sales target of $14,007 and finished $11,095 above target, making her the strongest performer in this comparison. Olivia King had a sales target of $18,971 and finished $9,766 below target, showing the largest negative performance gap among the employees shown. The difference between the strongest and weakest results shows that employee performance varied considerably. Management could use this information to understand what is helping stronger performers succeed and where additional support or performance review may be needed.
Top 5 Employees by Sales Performance
Bottom 5 Employees by Sales Performance


What Did Customers Say Through Their Ratings?
Customer satisfaction was mixed rather than consistently strong. The average rating was 3.05 out of 5. Four-star ratings were the most common with 217 responses, but there were also many lower ratings, including 190 one-star and 188 two-star responses. This suggests that Café Harmony has room to understand what is causing the lower ratings and improve the customer experience.
What the Analysis Showed
Key findings and why they matter for the business.
01 - MENU PERFORMANCE · FINDING
Muffin generated the highest sales revenue at about $2,401, followed by Cappuccino at about $2,315 and Iced Tea at about $2,235.
WHY IT MATTERS
These products are important revenue contributors, so keeping them available and understanding what drives their demand should remain a priority.
02 - CUSTOMER SPENDING · FINDING
The Adult group contributed the most sales at about $5,502, ahead of Old Adult and Young Adult.
This was the strongest customer group by spending and can help guide product, promotion and customer-targeting decisions.
03 - STOCK MANAGEMENT · FINDING
Milk showed the largest negative stock-performance value at -79, followed by Croissant Dough and Iced Tea Bags at -74.
These items should receive closer stock monitoring because they showed the largest negative gaps in the stock-performance analysis.
04 - EMPLOYEE PERFORMANCE · FINDING
Employee performance varied considerably. Megan White finished $11,095 above target, while Olivia King finished $9,766 below target.
The difference can help management identify strong performance practices and where additional support or review may be needed.
05 - CUSTOMER FEEDBACK · FINDING
The average customer rating was 3.05 out of 5, with both positive and lower ratings appearing frequently.
Customer experience is not consistently strong, so understanding the reasons behind lower ratings could help Café Harmony improve satisfaction.
Tools & Skills Demonstrated
Tools
Excel · PivotTables · PivotCharts · Excel Formulas
Analysis
Data Cleaning · Data Validation · Data Preparation · Sales Analysis · Customer Analysis · Employee Performance Analysis · Inventory Analysis
Reporting
KPI Reporting · Dashboard Design · Slicers · Data Visualization · Business Insights
What This Project Helped Me Practice
This project helped me practice more than just building charts in Excel. I had to decide which numbers mattered, what questions the data could answer and how to put everything together in a way that was easy to follow. One thing I paid attention to was making sure the dashboard did not overwhelm the person using it. I wanted someone to be able to open it and quickly understand what was happening with sales, customers, employees, stock and ratings. That process helped me improve both my Excel skills and the way I think about presenting data.
Explore the Project
The GitHub repository contains the files and documentation for this project.
View Project on GitHub